The manoeuvres performed in this simulation must never be performed on a real patient.
In this simulation, we’ll continue to explore the characteristics of a Veno-Venous Extra-Corporeal Membrane Oxygenation (VV ECMO) system.
The learning objectives of the session are to investigate:
| • | The impact of obstruction of the inlet or outlet line on ECMO system performance. |
We will be simulating the use of a system in a patient with essentially normal cardiovascular function, but with severe respiratory failure. The patient is a 24 year-old man, weighing 75 kgs, who has been transferred to your Intensive Care Unit for Veno-Venous ECMO. He had been admitted to the Intensive Care Unit of a large regional hospital 3 days before transfer to your institution. At that time, he presented a four day history of increasing respiratory distress, fever and a productive cough. The patient had been sedated, intubated and ventilated shortly after admission to the regional ICU. Blood and sputum cultures grew a methicillin-sensitive staphylococcus aureus. Despite treatment with appropriate antibiotics, the use of prone ventilation, permissive hypercarbia and inhaled nitric oxide, he continued to deteriorate. Following discussions with the clinicians at the regional hospital, he has been transferred to your institution for initiation of veno-venous ECMO. On arrival in your ICU the patient is being given assisted ventilation (via an ‘Ambu’ © bag) on 100% oxygen.
Blood gas analysis is reported as:
|
The patient has an Acute Lung Injury Score (‘Murray Score’) of 3.5 but has no other significant co-morbidities. He has a Haemoglobin of ~ 12 gm/dL and you estimate his ‘shunt fraction’ (Qs/Qt) to be about 65%. The results of some ancillary investigations (Echo, CXR and ECG) are also available.
We’ll assume that you have already worked your way through the previous VV ECMO tutorials, so we’ll quite quickly set up our monitoring:
| • | Click the <Display> button in the <Patient Monitor> window. |
| • | Check <ECG>, <Direct Arterial Pressure>, <Central Venous Pressure> and <SaO2> and |
| • | Click the <Display> button again to close this window and display the physiological signals. |
Ventilate the patient:
| • | Click the <Devices><Ventilator> menu item in the <Inspector> window. |
| • | Turn on the ventilator and set the tidal volume (Vt) to 500 mls, the rate to 12 bpm, the FiO2 to 100% and the PEEP to 5 cms H2O. |
Paralyse the patient:
| • | Click <Bolus Drug><Pancuronium (2mg/ml)>in the <Therapeutic Interface> window. |
| • | Drag the green slider until it says ~ 8 mgs and click the <Give> button. |
And perform a baseline blood gas analysis:
| • | Click <Investigations><Arterial Blood Gas Analysis>in the <Inspector> window. |
You elect to cannulate the patient percutaneously via the right and left internal jugular and right femoral veins using the Seldinger technique and ultrasonic guidance.
Imagine now that you have:
| • | Placed the Seldinger wires, |
| • | Given the patient 7500 units of heparin (Select <Heparin> from the <Therapeutic Interface> <Bolus Drug> page and <Give> 7500 units) and |
| • | Positioned the cannulae under ultrasonic control. |
The ECMO circuit we’ll be using is shown in Figure 1. We’re actively draining (sucking) blood from a point in the inferior vena cava just below the diaphragm, pumping it through the oxygenator and returning it via the superior vena cava to the right atrium (Figure 1.).
Figure 1.
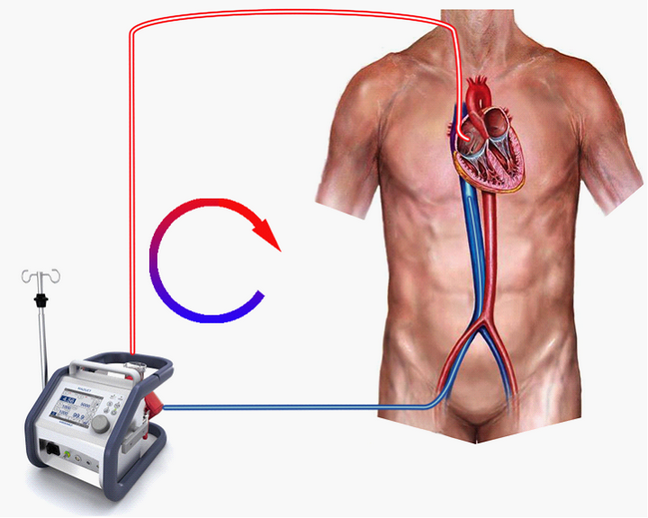
In this exercise, we’re only interested in the effect of obstruction of the drainage or return lines, so, initially, we’ll make sure that the venous drainage is absolutely optimal. To do this:
| • | Switch to the ECMO system (Devices><ECMO System>). |
| • | Click <Adjust Cannula>. |
| • | Slide the bottom left-hand slider up to <8> to advance the IVC cannula. |
| • | Switch back to the ECMO system (Devices><ECMO System>). |
| • | Turn on the <Main Power>. |
| • | Set a gas flow of <6> lpm. |
| • | Fully open the outlet (arterial) clamp. |
| • | Increase the blood flow to <3.5> lpm. |
| • | Start the timer. |
Note the pre-membrane pressure (~107 mm Hg), and the rpm (~2125).
After five minutes,
| • | Perform an <Oxygenator Blood Gas Analysis>. |
| • | Perform an <Arterial Blood Gas Analysis>. |
| • | Now ask the supervisor to kink the outlet (arterial) line and: |
| • | Re-start the timer. |
After five minutes,
| • | Repeat the <Oxygenator Blood Gas Analysis>. |
| • | Repeat the <Arterial Blood Gas Analysis>. |
Note the pre-membrane pressure has risen slightly to ~130 mm Hg, the rpm (~2125) are unchanged, but that the blood flow rate has fallen from <3.5> lpm to <0.6> lpm. Note also that the <Oxygenator Blood Gas Analysis> results have paradoxically ‘improved’ (the PO2 is higher and the PCO2 is lower) but that the patient’s arterial blood gas values have deteriorated again. So what’s happening here? If we look at the pressure and flow data first, we see that the pre-membrane pressure is now nearly equal to the stagnation pressure at this rpm and that the flow rate has fallen dramatically. – Nearly all of the pump’s energy is being used to overcome the additional resistance of the obstructed outlet line and very little flow is occurring (Figure 2.).
Figure 2 *.
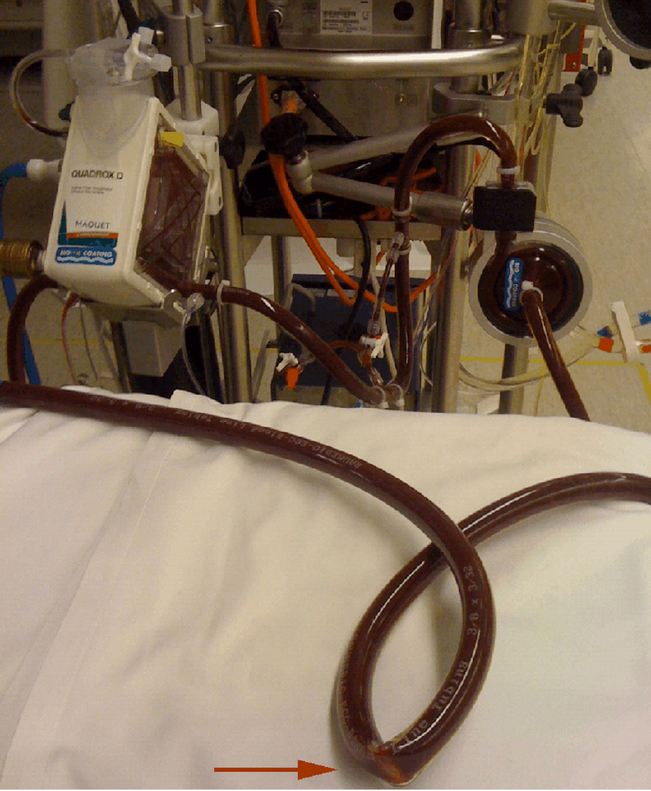
The low blood flow through the oxygenator in the face of an unchanged gas flow results in inadvertent hyperventilation of the artificial lung, so, in the blood leaving the oxygenator, the PCO2 falls quite markedly and the PO2 rises. Thus the hallmarks of outlet line obstruction can be summarized as: a rising pre-membrane pressure and falling blood flow rate in association with ‘Supernormal’ oxygenator blood gases. This can be compared with oxygenator failure, which may have a similar impact on oxygenator blood pressure and flow, but which is associated with a failure of gas transfer and deterioration in oxygenator blood gas values.
Let’s now examine what happens if we kink the inlet line to the system.
| • | Ask the supervisor to unkink the outlet line and: |
| • | Re-start the timer. |
After five minutes, note that the pre-membrane pressure has returned to ~107 mm Hg and the flow rate to ~ 3.5 lpm.
Now:
| • | Ask the supervisor to kink the inlet line and: |
| • | Re-start the timer. |
After five minutes,
| • | Repeat the <Oxygenator Blood Gas Analysis>. |
| • | Repeat the <Arterial Blood Gas Analysis>. |
Note the pre-membrane pressure has dropped markedly to ~15 mm Hg, the rpm (~2125) are unchanged, and that the blood flow rate has fallen from <3.5> lpm to <0.5> lpm. The blood gas pictures in the oxygenator blood and the arterial blood are very similar to those which were found when the outlet line was partially obstructed. The explanation of these results is that the pump is being ‘starved’ of inflow and consequently is unable to generate an outlet pressure because there is, quite simply, no blood to pump. Once again, the low blood flow through the oxygenator in the face of an unchanged gas flow results in inadvertent hyperventilation of the artificial lung, so, in the blood leaving the oxygenator, the PCO2 falls quite markedly and the PO2 rises.
In summary, the hallmarks of inlet line obstruction are: a falling pre-membrane pressure and falling blood flow rate in association with ‘Supernormal’ oxygenator blood gases.
In real life, how should we prevent inlet or outlet line obstruction?
Two simple measures which can be taken are to:
| • | Ensure that long tubing runs are avoided (so that redundant circuit loops cannot form). |
| • | Ensure that the entire circuit is kept exposed and therefore visible (and not concealed under sheets). |
This concludes VV ECMO tutorial 4.
* I am grateful to Claudio Soto, Perfusionist, St Vincent’s Hospital, Sydney for permission to use this photograph.