In this simulation, we’ll explore the basic behaviour of a modern veno-arterial (VA) Extra-Corporeal Membrane Oxygenation (ECMO) system.
The learning objectives of the session are:
| • | To understand the design of a simple veno-arterial ECMO circuit. |
| • | To become familiarized with the basic controls of an ECMO system. |
| • | To understand the mechanism of ‘Differential Hypoxia’. |
We will be simulating the use of a system in a patient with normal cardio-respiratory function before moving on to treating patients with severe cardio-respiratory impairment in subsequent sessions.
Scenario:
Briefly, the patient is a fit 30 year old who weighs 70 kgs. For the purposes of the tutorial we’re going to imagine that he’s been intubated (and perhaps surprisingly, is tolerating the endotracheal tube very well!).
We’ll start by connecting him to our monitoring system:
|
Click the <Display> button in the <Patient Monitor> window. |
Clicking the <Display> button on the Patient Monitor allows you to select the parameters which you want to view.
|
Check <ECG>, <Direct Arterial Pressure>, <Central Venous Pressure> and <SaO2> in the <Display> window. |
|
Click the <Display> button in the <Patient Monitor> window. |
The <Display> window will now close, and the ECG, Direct Arterial Pressure, Central Venous Pressure and SaO2 signals will be displayed in the <Patient Monitor> window. It should be noted that the arterial pressure is being measured in the right radial artery. As you can see, the patient is normotensive, with a pulse rate of about 70 bpm and a central venous pressure of ~ 3 mm Hg. The pulse oximeter is indicating a saturation of ~98%. In order to eliminate the effects of spontaneous ventilation, and to make the scenario more typical of a real patient on VA ECMO, we’ll also ventilate him. Currently, the system always assumes that the patient is intubated, so in order to do this, simply:
|
Click the <Devices><Ventilator> menu item in the <Inspector> window. |
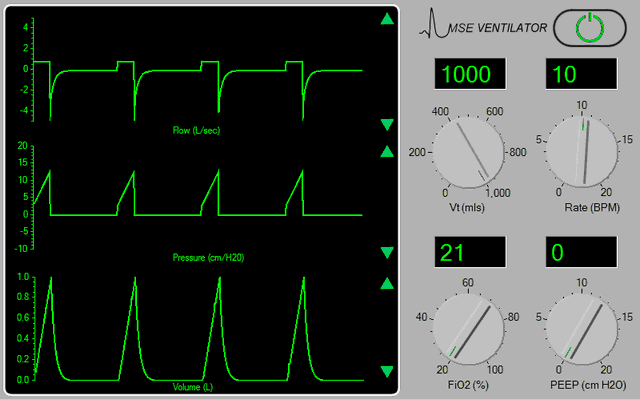
When the ventilator appears in the <Inspector> window (Figure 1):
Figure 1.
|
Turn the ventilator on by clicking the power switch at the top right-hand side of the device, and then choose the settings which you think are appropriate by ‘dragging’ on the control knobs. |
**Note that the ventilator’s controls are not enabled until the ventilator is turned <on>.
**For the purpose of this tutorial, ensure that the Inspired Oxygen concentration is set to 21%.
In order to assess the patient’s gas exchange:
|
Click the <Display> button in the <Patient Monitor> window. |
|
Check < Capnography > and < Gases > in the <Display> window. |
|
Click the <Display> button in the <Patient Monitor> window. |
And perform a baseline blood gas analysis:
|
Click <Investigations><Arterial Blood Gas Analysis>in the <Inspector> window. |
To paralyse the patient and control his ventilation:
|
Click <Bolus Drug><Pancuronium (2mg/ml)>in the <Therapeutic Interface> window. |
|
Drag the green slider until it says ~ 8 mgs and click the <Give> button. |
If you wish to monitor the onset of muscle paralysis by monitoring his ‘Train of Four’:
|
Click the <Devices><Nerve Stimulator> menu item in the <Inspector> window. |
|
Click the <TOF> button on the nerve stimulator itself. |
Sedation may be administered by selecting the appropriate bolus or infusion drugs using the <Therapeutic Interface> and monitoring the depth of sedation by turning on the <BIS> display on the physiological monitor. You elect to cannulate the patient percutaneously employing the Seldinger technique and using a 21F cannula in the right femoral artery and 24F cannula in the right femoral vein.
Imagine now that you have:
| • | Placed the Seldinger wires in the artery and vein, |
| • | Given the patient 7500 units of heparin (Select <Heparin> from the <Therapeutic Interface> <Bolus Drug> page and <Give> 7500 units) and |
| • | Positioned the cannulae under ultrasonic control. |
The cannulae have been connected to the ECMO system. The entire system is heparin-coated. The system’s centrifugal pump is responsible both for generating the negative pressure which is required to facilitate drainage and the positive pressure which is required to pump blood through the artificial lung and back into the patient. The pump head and oxygenator are integrated into a single, disposable unit which is mounted on the system console.
Figure 2.
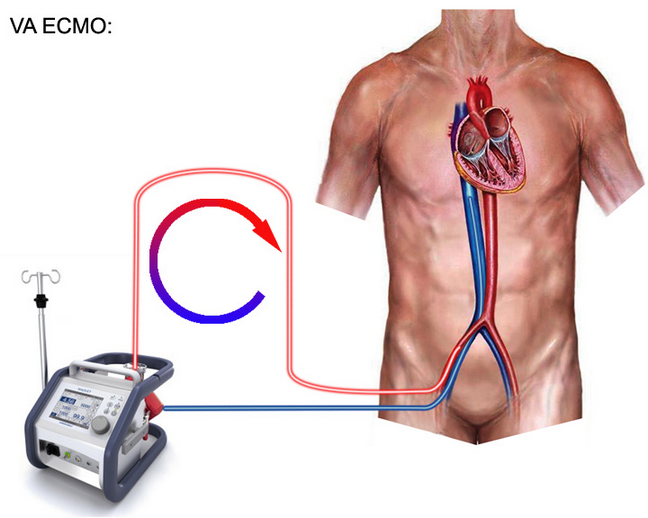
Active venous drainage from the inferior vena cava is via the 24F venous cannula and return via the 21F arterial cannula. A femoral ‘backflow’ cannula has not been used (Figure 2). Before commencing ECMO you may wish to confirm that the patient is effectively anti-coagulated. Select <Devices><ACT Monitor> and click <Start> in order to commence the measurement. If you do this, you’ll need to click <Devices><ECMO System> to return to the ECMO interface. (You can periodically return to the ACT Monitor to check on the progress of the estimation). Additional information regarding the ECMO system can be found by clicking on the <Resources> menu of the <Inspector> window and selecting the resource which you want to view. These resources include lectures on ECMO, images of various systems, relevant websites and various descriptions and protocols relating to the technique.
To visualize the ECMO interface itself:
|
Click on the <Devices> <ECMO System> menu item of the <Inspector> window. |
|
Select the <VA ECMO> option at the bottom right of the interface. |
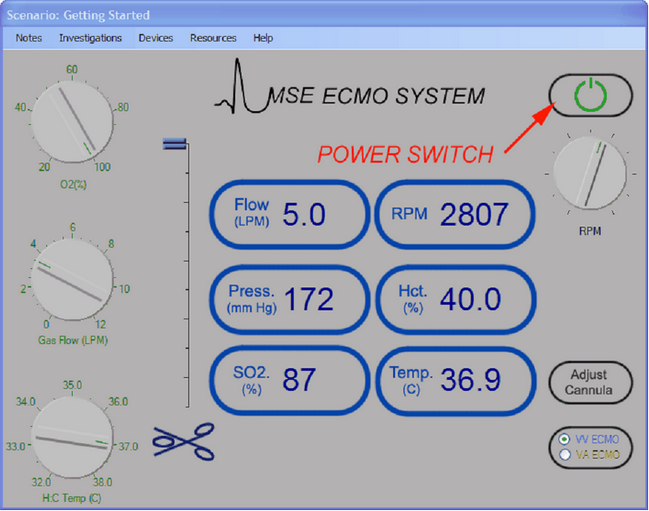
The key components of the system interface are shown above.
To the left of the interface are three controls which control respectively the inspired oxygen concentration (%) of gas flowing through the oxygenator; the gas flow rate (lpm) to the oxygenator; and the temperature setting control (Co) for the heater: cooler. The heater: cooler can be used to vary the patient’s temperature (and metabolic rate).
Between these three controls and the ‘CardioHelp’ data display area is the electronic clamp which controls flow through the outlet (Arterial) side of the pump. When the slider is at the bottom, the clamp is fully closed, when at the top, fully open.
The data display area displays the current values of:
| • | Flow through the system in lpm, |
| • | Pre-membrane circuit pressure measured between the pump head and the oxygenator, |
| • | Venous oxygen saturation, |
| • | Pump speed in rpm, |
| • | Haematocrit and |
| • | Blood Temperature. |
To the right of the display area are four controls.
| • | The main power switch enables the flow control knob which is situated just beneath it. |
| • | The flow control is used to adjust the speed of the centrifugal pump in the range 0 – 5000 rpm. |
| • | The <Adjust Cannula> button allows you to move the drainage cannula(e) in or out and to select the size of your return (Arterial) cannula. |
| • | Finally, the <Mode> button is used to set the system up for either VV or VA ECMO. |
**Note that the flow control is not enabled until the ECMO system is turned <On>.
The first exercise we’ll be undertaking is initiation of VA ECMO.
First, we’ll perform a baseline blood gas analysis (<Investigations><Arterial Blood Gas Analysis>) and then return to the ECMO system (<Devices> <ECMO System>).
Click the <Adjust Cannula> button and advance the drainage cannula as far as it will go using the slide control on the left hand side of the window then re-open the ECMO interface by clicking <Devices><ECMO System>.
|
Click the main power button at the top right of the interface. |
Turn on 4 LPM of oxygen using the middle knob at the left of the interface.
At this point we’re ready to initiate ECMO. However, we must remember that, unlike the case for VV ECMO, there is a pressure gradient across the circuit and if we simply open the clamp, blood will flow from the arterial side of the circuit to the venous side and a large left-to-right shunt will be created.
In order to avoid this effect, we need to generate a ‘stagnation pressure’ that is a little bit above the patient’s mean arterial pressure. To do this, slowly turn up the flow control until the indicated pressure is ~ 10 mm Hg above the patient’s mean arterial pressure with the clamp still fully closed.
Now progressively release the arterial clamp by moving the slide control upwards and observe that flow increases to about 1 lpm.
Increase the flow further by slowly rotating the flow control and note how the patient’s pulse pressure becomes progressively smaller until it eventually disappears altogether.
Also note that if you go on rotating the flow control, the indicated flow reaches a maximum (at about 4.7 lpm) and then starts to decrease. We’ll explore the reasons for this in a future tutorial, but for the moment, just accept it and:
|
Adjust the flow control knob so that the maximum blood flow rate is achieved. |
At this point the patient is on full cardio-pulmonary bypass, the aortic valve remains closed throughout the cardiac cycle and there is no flow through the pulmonary circulation or the left side of the heart. After a few minutes, note that carbon dioxide has virtually disappeared from the capnography trace and that the end-tidal CO2 is close to zero. Also note that the pulse oximeter has stopped reporting the patient’s saturation (because pulsatile blood flow has ceased).
Perform a blood gas analysis (<Investigations><Arterial Blood Gas Analysis>) and note that the PaO2 is now ~ 450 - 500 mm Hg and that there is mild hypocarbia. These results are typical for a normally-functioning VA ECMO system when 100% oxygen is administered under full bypass conditions.
Under these conditions, we could if we wanted, turn the ventilator completely off. However, in this tutorial, we won’t do this!
It is debatable whether or not a patient should be maintained on full bypass if clinically satisfactory conditions can be obtained by using only partial support. Full bypass abolishes pulmonary arterial flow and entails the risks of left heart distension, pulmonary or left heart thrombosis and coronary ischaemia (due to increased left ventricular wall stress). In contrast, partial bypass maintains pulmonary flow and reduces the risks of left heart distension and thrombosis, but creates the possibility of differential hypoxia and mandates some form of ongoing ventilation.
We’ll now examine what happens if we adjust the ECMO system to provide only partial support.
|
Very slowly rotate the flow control knob so that a blood flow rate of ~ 2.5 lpm is achieved. |
Note that pulsatile blood flow returns and that the pulse oximeter starts working again. Note also, that carbon dioxide has now re-appeared in the capnograph trace and that the end-tidal CO2 is about 12 – 15 mm Hg.
After a few minutes in this state:
|
Perform an arterial blood gas analysis. (Investigations> <Arterial Blood Gas Analysis>. |
And:
|
Perform an oxygenator blood gas analysis. (Investigations> <Oxygenator Blood Gas Analysis>. |
Examine the two blood gas reports and note the differences:
| 1. | The radial arterial PO2 is much lower than the oxygenator PO2. |
| 2. | The radial arterial PCO2 is much lower than the oxygenator PCO2. |
| 3. | There is a marked respiratory alkalosis in the radial sample. |
So what’s going on here? Well, this is an example of ‘Differential Hypoxia’. – Because the patient is only on partial cardio-pulmonary bypass (and has a considerable amount of blood flowing through his own lungs), the upper part of the body (including the right radial artery) is being perfused with blood which has been pumped out of the left ventricle. This blood has reached the left ventricle from the native lung – which is being relatively over-ventilated with a gas mixture containing only 21% oxygen. Hence, the lower PO2 and PCO2.
In contrast, the lower part of the patient’s body is being perfused with blood exiting the femoral arterial cannula. This blood has passed through the oxygenator which is supplied with 100% oxygen and is less markedly over-ventilated. As a result, the PO2 and PCO2 are considerably higher.
If peripheral arterial cannulation is used, the ratio of oxygenator blood flow to total systemic flow determines the point in the aorta where there is a mixing interface between blood which has passed through the oxygenator, and blood which has passed through the native lung.
As oxygenator flow is increased, so this point moves closer and closer to the aortic valve, until, on full bypass, aortic valve opening ceases, all systemic flow is derived from blood which has passed through the oxygenator and differential hypoxia disappears.
It should be noted that the two arterial systems which are at greatest risk of differential hypoxia are the coronary and innominate vascular beds. It should also be noted that the problem of differential hypoxia relates only to those undergoing VA ECMO and cannot occur in those being treated with VV ECMO.
We’ll conclude this exercise by weaning the patient from VA ECMO.
To do this, slowly reduce the blood flow through the ECMO system by reducing the rpm until a flow rate of ~ 1 lpm is observed. Note that pulsatility increases further and that the end-tidal CO2 has risen to a more ‘normal’ level. Now progressively clamp the arterial line by dragging the slider of the electronic clamp downwards until all forward flow ceases. Finally reduce the rpm to zero and turn the ECMO system off.
This technique of weaning ensures that the arterial line is fully-occluded before the rpm are reduced below a level which permits backflow to occur.
This concludes our introductory tutorial to VA ECMO. In future tutorials we’ll examine the problem of backflow, explore the impact of VA-ECMO on a patient in cardiogenic shock, and take a look at some of the complications of this form of therapy