Some of the manoeuvres undertaken in this tutorial generate extreme circuit pressures and are only intended to demonstrate the performance characteristics of the system. They should not be employed under clinical conditions.
In this simulation, we’ll continue to explore the characteristics of a Veno-Venous Extra-Corporeal Membrane Oxygenation (VV ECMO) system.
The learning objectives of the session are to investigate:
| • | The effect of cannula position on ECMO system performance. |
| • | The effect of temperature control on metabolic rate (and oxygenation). |
We will be simulating the use of a system in a patient with essentially normal cardiovascular function, but with severe respiratory failure. The patient is a 24 year-old man, weighing 75 kgs, who has been transferred to your Intensive Care Unit for Veno-Venous ECMO. He had been admitted to the Intensive Care Unit of a large regional hospital 3 days before transfer to your institution. At that time, he presented a four day history of increasing respiratory distress, fever and a productive cough. The patient had been sedated, intubated and ventilated shortly after admission to the regional ICU. Blood and sputum cultures grew a methicillin-sensitive staphylococcus aureus. Despite treatment with appropriate antibiotics, the use of prone ventilation, permissive hypercarbia and inhaled nitric oxide, he continued to deteriorate. Following discussions with the clinicians at the regional hospital, he has been transferred to your institution for initiation of veno-venous ECMO. On arrival in your ICU the patient is being given assisted ventilation (via an ‘Ambu’ © bag) on 100% oxygen.
Blood gas analysis is reported as:
PaO2 |
43 mm Hg |
PaCO2 |
41 mm Hg |
pH |
7.35 |
BXS |
-1.0 |
Temp |
37.0 |
SaO2 |
68% |
The patient has an Acute Lung Injury Score (‘Murray Score’) of 3.5 but has no other significant co-morbidities. He has a Haemoglobin of ~ 12 gm/dL and you estimate his ‘shunt fraction’ (Qs/Qt) to be about 65%. The results of some ancillary investigations (Echo, CXR and ECG) are also available.
We’ll start the tutorial by connecting the patient to our monitoring system and putting him on a ventilator.
To do this:
| • | Click the <Display> button in the <Patient Monitor> window. |
| • | Check <ECG>, <Direct Arterial Pressure>, <Central Venous Pressure> and <SaO2 and |
| • | Click the <Display> button again to close this window and display the physiological signals. |
As you can see, the patient is profoundly hypoxic (SaO2 ~ 70%) and is having frequent ventricular ectopic beats.
To ventilate the patient:
| • | Click the <Devices><Ventilator> menu item in the <Inspector> window. |
The ventilator should now appear in the <Inspector> window.
Turn the ventilator on by:
| • | Clicking the power switch at the top right-hand side of the device, and then |
| • | Set the tidal volume(Vt) to 500 mls, the rate to 10 bpm, the FiO2 to 100% and the PEEP to 5 cms H2O. |
**Note that the ventilator’s controls are not enabled until the ventilator is turned <On>.
The ventilator is based on a simple anaesthesia system which is in ‘Intermittent Mandatory Ventilation’ (IMV) mode. Because the patient is still breathing spontaneously, the flow, pressure and volume traces appear somewhat disorganised.
In order to fix this, you may wish to control the patient's ventilation. To do this:
| • | Click <Bolus Drug><Pancuronium (2mg/ml)>in the <Therapeutic Interface> window. |
| • | Drag the green slider until it says ~ 8 mgs and click the <Give> button. |
If you wish to monitor the onset of muscle paralysis by monitoring his ‘Train of Four’:
| • | Click the <Devices><Nerve Stimulator> menu item in the <Inspector> window. |
| • | Click the <TOF> button on the nerve stimulator itself. |
Sedation may be administered by selecting the appropriate bolus or infusion drugs using the <Therapeutic Interface> and monitoring the depth of sedation by turning on the <BIS> display on the physiological monitor.
In order to assess the patient’s gas exchange you may want to turn on the gas analyser:
|
| • | Check < Capnography > and < Gases > in the <Display> window. |
| • | Click the <Display> button again to close this window and display the additional signals. |
And perform a baseline blood gas analysis:
| • | Click <Investigations><Arterial Blood Gas Analysis>in the <Inspector> window. |
You elect to cannulate the patient percutaneously via the right internal jugular and femoral veins using the Seldinger technique and ultrasonic guidance.
Imagine now that you have:
| • | Placed the Seldinger wires, |
| • | Given the patient 7500 units of heparin (Select <Heparin> from the <Therapeutic Interface> <Bolus Drug> page and <Give> 7500 units) and |
| • | Positioned the cannulae under ultrasonic control. |
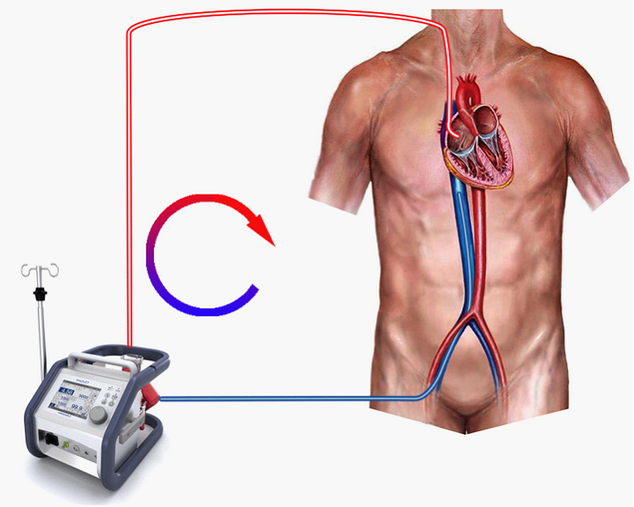
The cannulae are connected to the ECMO system. The entire system is heparin-coated. Active venous drainage from the inferior vena cava (IVC) is via a 24F femoral cannula and ‘arterialised’ return to the right atrium via a 21F Internal Jugular cannula. The system’s centrifugal pump is responsible both for generating the negative pressure which is required to facilitate drainage and the positive pressure which is required to pump blood through the artificial lung and back into the patient. The pump head and oxygenator are integrated into a single, disposable unit which is mounted on the system console.
Figure 1.
Before commencing ECMO you may wish to confirm that the patient is effectively anti-coagulated:
| • | Select <Devices><ACT Monitor> and |
| • | Click <Start> in order to commence the measurement. |
The ECMO circuit we’ll be using is shown in Figure 1. We’re actively draining (sucking) blood from a point in the inferior vena cava just below the diaphragm, pumping it through the oxygenator and returning it via the superior vena cava to the right atrium. Additional information regarding the ECMO system can be found by clicking on the <Resources> menu of the <Inspector> window and selecting the resource which you want to view. These resources include lectures on ECMO, images of various systems, relevant websites and various descriptions and protocols relating to the technique.
To visualize the interface of the ECMO system itself:
| • | Click <Devices> <ECMO System> in the <Inspector> window. |
We’re going to start by initiating ECMO with a single drainage cannula positioned in the infra-hepatic region of the IVC and a single (21F), correctly positioned, return cannula.
To initiate VV ECMO:
| • | Turn the ECMO power switch <On>. |
| • | Set a flow of oxygen of about 6 lpm. |
| • | Set an inspired oxygen concentration of 100%. |
| • | Fully release the outlet clamp by sliding the clamp control to the top of the scale and |
| • | Slowly increase the pump rpm until the maximum blood flow rate (of ~3.4 lpm) is reached. |
**Note that if the rpm continue to be increased after 3.4 lpm is reached, flow progressively declines until eventually, it ceases altogether.
This plateauing (and subsequent decline) of ECMO blood flow with increasing rpm is known as ‘Inflow Limitation’. – Remember that the centrifugal pump is generating a positive pressure on its outlet side and a negative pressure on its inlet (drainage) side. In this case, because the central venous pressure is relatively low and the wall of the IVC is quite close to the drainage cannula, the wall gets ‘sucked’ onto the cannula drainage ports and begins to limit inflow. As the rpm are further increased, more and more cava is sucked onto the cannula until eventually drainage ceases altogether, and no forward flow is generated at all. After five minutes, you’ll see that the arterial saturation has risen to about 87% and that the end-tidal CO2 has fallen quite markedly. Repeat the <Arterial Blood Gas Analysis> and note that the patient is now mildly hypocarbic and that the PaO2 has risen to ~ 55 mm Hg, but is still not great. – Clearly, we’ve made some progress, but we’re not yet in control.
In this situation, there are a few things which we can do in an attempt to improve oxygenation. These include:
| • | Ensuring that the patient’s metabolic rate (and oxygen consumption) is kept low, and |
| • | Ensuring that we have optimal venous drainage into the ECMO system. |
If you check the patient’s temperature (<Display><Temperature>), you’ll see that he is pyrexial. We can correct this by cooling the patient using the ECMO system.
To do this:
| • | Adjust the <HC Temp> control to <33C> on the ECMO device. |
Ensuring optimal venous drainage is important, because we want to pass as great a proportion as possible of the patient’s venous return through the ECMO system. (Theoretically, if we are able to ‘capture’ all of this return and oxygenate and remove carbon dioxide from it, there would be no need for the patient’s native lung to make any contribution at all to gas exchange, and the native lung could be completely ‘rested’ in order to allow healing to occur.) Ideally, we need to drain blood separately from the Superior Vena Cava (SVC) and IVC blood using separate cannulae and we’ll explore the effect of using dual drainage cannulae in a future tutorial. However, for the moment, we’ll stay with a single drainage cannula and explore the effect of advancing the cannula up the IVC.
To do this:
| • | Click the <Adjust Cannula> button. |
| • | Slide the blue slider at the left-hand side of the CXR to position ‘8’. (This will advance the drainage cannula to the optimal position.) |
| • | Click <Devices> <ECMO System> in the <Inspector> window. |
You should see that there has been a small increase in ECMO flow (from ~3.4 to ~ 4.0 lpm).
Apart from positioning the drainage cannula there are two other techniques which we can use to increase venous return through the system. In particular, elevation of the CVP (by transfusion or posture adjustment) and the use of dual cannulae should be considered when confronted with this problem. So, at this stage in the exercise, we’ve done two things in an attempt to improve oxygenation:
| 1. | We’ve advanced the cannula further up the IVC and |
| 2. | We’ve cooled the patient in order to lower his oxygen consumption. |
Given that the patient is mildly hypocarbic, we can also reduce his total ventilation. To do this:
| • | Reduce the gas flow to the oxygenator to 3.0 lpm, |
| • | Reduce his tidal volume to 200 mls and |
| • | Reduce the ventilatory frequency to 5 bpm. |
After ten minutes or so, note that his saturation has risen further (to ~ 93%) and that his temperature has fallen to ~ 35 C.
At this stage, a repeat blood gas analysis should show a PO2 of about 65 and a PCO2 of ~40.
The effect of temperature on metabolic rate has been studied by various authors. In this simulator, the data of Kirklin et al has been used to determine the magnitude of the effect. In Figure 2, the effect of temperature on oxygen consumption (VO2 ) in a patient with a VO2 of 200 mls/min @ 37C is shown.
Figure 2.
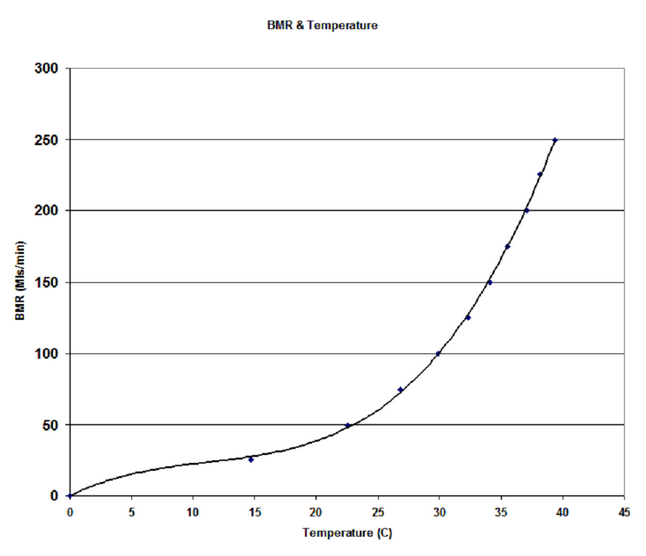
We can formulate the relationship between VO2 and temperature as a third ‘rule’ of ECMO:
VO2 is proportional to Heater:Cooler Temperature.
The impact of changing the patient’s temperature on SaO2 is shown in Figure 3.
Figure 3.
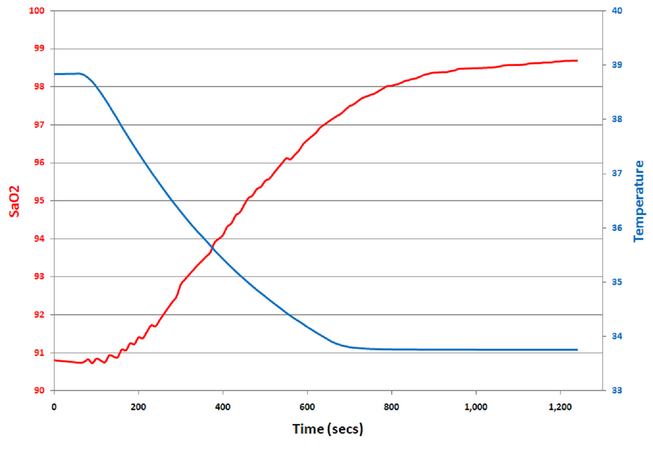
In this case, I’ve taken a pyrexial patient (38.8C) on stable VV ECMO and, over a period of ten minutes, cooled him by 5.0C. Note how the arterial saturation rises from ~ 91% to ~ 99%.
This concludes the exercise. In future tutorials we’ll examine the effect of using dual drainage cannulae and changing the size of the return cannula on the efficacy of ECMO.
References:
Kirklin JW and Barratt-Boyes BG. 'Cardiac Surgery'. New York: Churchill Livingstone, 1993:61-127.