Some of the manoeuvres undertaken in this tutorial generate extreme circuit pressures and are only intended to demonstrate the performance characteristics of the system. They should not be employed under clinical conditions.
In this simulation, we’ll explore the fundamental characteristics of a modern centrifugal pump - which can be used in either a veno-venous (VV) or veno-arterial (VA) Extra-Corporeal Membrane Oxygenation (ECMO) system.
The learning objectives of the session are:
| • | To understand the design of a basic veno-venous ECMO circuit. |
| • | To become familiarized with the basic controls of an ECMO system. |
| • | To become familiarized with the basic behaviour of a centrifugal pump. |
We will be simulating the use of a system in a patient with essentially normal cardiovascular function, but with severe respiratory failure. The patient is a 24 year-old man, weighing 75 kgs, who has been transferred to your Intensive Care Unit for Veno-Venous ECMO. He had been admitted to the Intensive Care Unit of a large regional hospital 3 days before transfer to your institution. At that time, he presented a four day history of increasing respiratory distress, fever and a productive cough. The patient had been sedated, intubated and ventilated shortly after admission to the regional ICU. Blood and sputum cultures grew a methicillin-sensitive staphylococcus aureus. Despite treatment with appropriate antibiotics, the use of prone ventilation, permissive hypercarbia and inhaled nitric oxide, he continued to deteriorate. Following discussions with the clinicians at the regional hospital, he has been transferred to your institution for initiation of veno-venous ECMO. On arrival in your ICU the patient is being given assisted ventilation (via an ‘Ambu’ © bag) on 100% oxygen.
Blood gas analysis is reported as:
PaO2 |
45 mm Hg |
PaCO2 |
44 mm Hg |
pH |
7.3 |
BXS |
- 3.5 |
Temp |
37.0 |
SaO2 |
74% |
The patient has an Acute Lung Injury Score (‘Murray Score’) of 3.5 but has no other significant co-morbidities. He has a Haemoglobin of ~ 12 gm/dL and you estimate his ‘shunt fraction’ (Qs/Qt) to be about 65%. The results of some ancillary investigations (Echo, CXR and ECG) are also available.
|
Click the <Investigations> <TG SAX> in the <Inspector> window. |
We’ll start the tutorial by connecting the patient to our monitoring system and putting him on a ventilator.
|
Click the <Display> button in the <Patient Monitor> window. |
Clicking the <Display> button on the Patient Monitor allows you to select the parameters which you want to view.
|
Check <ECG>, <Direct Arterial Pressure>, <Central Venous Pressure> and <SaO2> in the <Display> window. |
|
Click the <Display> button in the <Patient Monitor> window. |
The <Display> window will now close, and the ECG, Direct Arterial Pressure, Central Venous Pressure and SaO2 signals will be displayed in the <Patient Monitor> window. As you can see, the patient is profoundly hypoxic (SaO2 ~ 70%) and is having frequent ventricular ectopic beats.
To ventilate the patient:
|
Click the <Devices><Ventilator> menu item in the <Inspector> window. |
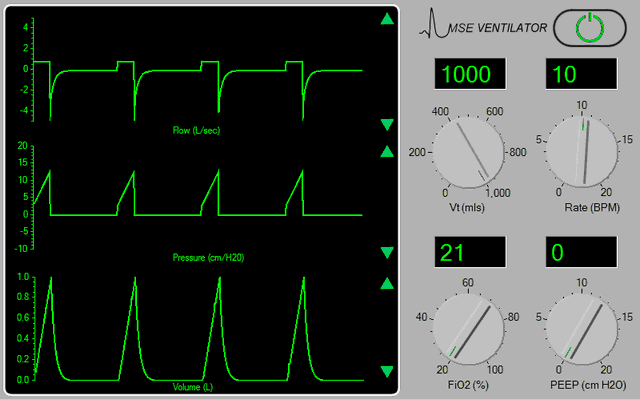
The ventilator should now appear in the <Inspector> window (Figure 1).
Figure 1.
|
Turn the ventilator on by clicking the power switch at the top right-hand side of the device. Set the tidal volume (Vt) to 500 mls, the rate to 12 bpm, the FiO2 to 100% and the PEEP to 5 cms H2O. |
**Note that the ventilator’s controls are not enabled until the ventilator is turned <on>.
The ventilator is based on a simple anaesthesia system which is in ‘Intermittent Mandatory Ventilation’ (IMV) mode. At this time, the pressure, flow and volume signals appear somewhat chaotic (because the patient is also breathing spontaneously). If any of the signal traces appear discontinuous, adjust the gain of the appropriate signal channel using the green arrows at the right-hand side of the display. Also note that the peak airway pressure is very high (~ 35 cms H2O) - because the patient has a very low static lung compliance ( < 20 mls / cm H2O).
Stop the patient 'fighting' the ventilator by controlling his ventilation. To do this:
|
Click <Bolus Drug><Pancuronium (2mg/ml)>in the <Therapeutic Interface> window. |
|
Drag the green slider until it says ~ 8 mgs and click the <Give> button. |
If you wish to monitor the onset of muscle paralysis by monitoring his ‘Train of Four’:
|
Click the <Devices><Nerve Stimulator> menu item in the <Inspector> window. |
|
Click the <TOF> button on the nerve stimulator itself. |
In order to assess the patient’s gas exchange:
|
Click the <Display> button in the <Patient Monitor> window. |
|
Check < Capnography > and < Gases > in the <Display> window. |
|
Click the <Display> button in the <Patient Monitor> window. |
And perform a baseline blood gas analysis:
|
Click <Investigations><Arterial Blood Gas Analysis> in the <Inspector> window. |
You may also wish to paralyse the patient and control his ventilation. To do this:
|
Click <Bolus Drug><Pancuronium (2mg/ml)>in the <Therapeutic Interface> window. |
|
Drag the green slider until it says ~ 8 mgs and click the <Give> button. |
If you wish to monitor the onset of muscle paralysis by monitoring his ‘Train of Four’:
|
Click the <Devices><Nerve Stimulator> menu item in the <Inspector> window. |
|
Click the <TOF> button on the nerve stimulator itself. |
Sedation may be administered by selecting the appropriate bolus or infusion drugs using the <Therapeutic Interface> and monitoring the depth of sedation by turning on the <BIS> display on the physiological monitor.
You elect to cannulate the patient percutaneously via the right internal jugular and femoral veins using the Seldinger technique and ultrasonic guidance.
Imagine now that you have:
| • | Placed the Seldinger wires, |
| • | Given the patient 7500 units of heparin (Select <Heparin> from the <Therapeutic Interface> <Bolus Drug> page and <Give> 7500 units) and |
| • | Positioned the cannulae under ultrasonic control. |
The cannulae are connected to the ECMO system. The entire system is heparin-coated. Active venous drainage from the inferior vena cava is via a 24F femoral cannula and ‘arterialised’ return to the right atrium via a 21F Internal Jugular cannula. The system’s centrifugal pump is responsible both for generating the negative pressure which is required to facilitate drainage and the positive pressure which is required to pump blood through the artificial lung and back into the patient. The pump head and oxygenator are integrated into a single, disposable unit which is mounted on the system console.
Before commencing ECMO you may wish to confirm that the patient is effectively anti-coagulated. Select <Devices><ACT Monitor> and click <Start> in order to commence the measurement. The ECMO circuit we’ll be using is shown in Figure 2. We’re actively draining (sucking) blood from a point in the inferior vena cava just below the diaphragm, pumping it through the oxygenator and returning it via the superior vena cava to the right atrium.
Figure 2.
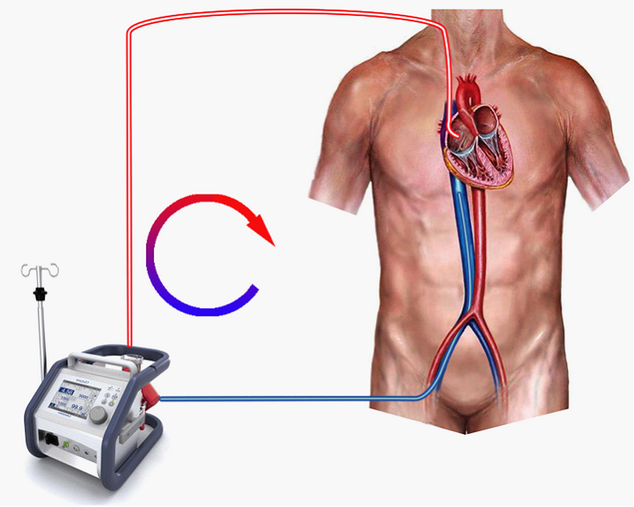
In essence, what we’re trying to do when we put a patient on VV ECMO, is to ‘capture’ as large a proportion of his venous return as we can and pump it through an artificial lung where carbon dioxide will be removed and oxygen added. This oxygenated blood is then pumped back into the circulation close to the tricuspid valve, from where it flows into the right ventricle and through the patient’s own lungs. In theory, if we can capture the patient’s entire venous return, his native lung will have no need to participate in gas exchange at all and so can be completely ‘rested’ (not ventilated) - in order to permit healing to occur.
To visualize the interface of the ECMO system itself:
|
Click <Devices> <ECMO System> in the <Inspector> window. |
The key components of the interface are shown in Figure 3.
Figure 3.
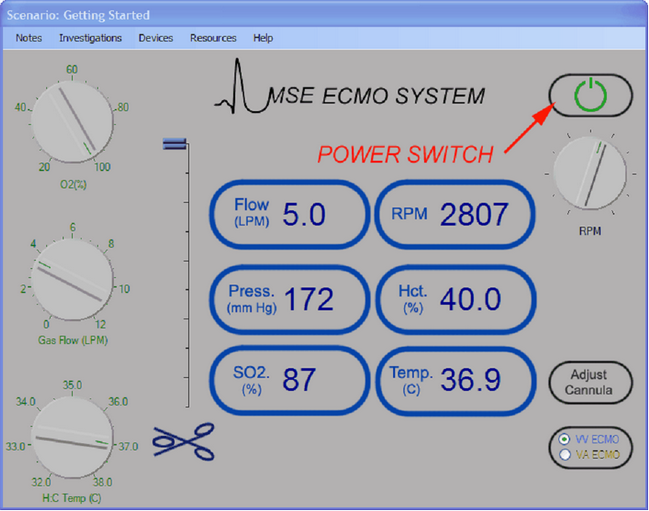
To the left of the interface are three controls which control respectively the inspired oxygen concentration (%) of gas flowing through the oxygenator; the gas flow rate (lpm) to the oxygenator; and the temperature setting control (Co) for the heater: cooler. In the context of VV ECMO, the FiO2 control should always be set at 100%. The gas flow rate control is used to control CO2 elimination (the higher the gas flow rate, the greater the rate of CO2 clearance). The heater: cooler can be used to vary the patient’s temperature (and metabolic rate). Between these three controls and the data display area is the electronic clamp which controls flow through the outlet (‘Arterial’) side of the pump. When the slider is at the bottom, the clamp is fully closed, when at the top, fully open.
The data display area displays the current values of:
| • | Blood flow through the system in lpm, |
| • | Circuit pressure measured at a point between the pump head and the oxygenator, |
| • | Venous oxygen saturation, |
| • | Pump speed in rpm, |
| • | Haematocrit and |
| • | Blood Temperature. |
To the right of the display area are four controls.
| • | The main power switch enables the flow control knob which is situated just beneath it. |
| • | The flow control is used to adjust the speed of the centrifugal pump in the range 0 – 5000 rpm. |
| • | The <Adjust Cannula> button allows you to move the drainage cannula(e) in or out and to select size of your return cannula. |
| • | Finally, the <Mode> button is used to set the system up for either VV or VA ECMO. |
**Note that the flow control is not enabled until the ECMO system is turned <On>.
Additional information regarding the ECMO system can be found by clicking on the <Resources> menu of the <Inspector> window and selecting the resource which you want to view. These resources include lectures on ECMO, images of various systems, relevant websites and various descriptions and protocols relating to the technique.
Before commencing VV ECMO you may wish to confirm that the patient is effectively anti-coagulated:
|
Select <Devices><ACT Monitor> and click <Start> in order to commence the measurement. |
If you do this, you’ll need to click <Devices><ECMO System> to return to the ECMO interface. (You can periodically return to the ACT Monitor to check on the progress of the estimation).
If you decide that you need to give more Heparin:
Select <View><Therapeutic Interface> from the main menu. When the <Therapeutic Interface> window has opened, select <Heparin> as a bolus drug and give an appropriate dose.
In the first part of the tutorial, we’re going to turn on the pump and examine its behaviour when confronted with an excessive afterload.
|
Click the power switch of the ECMO system and slowly rotate the flow control clockwise. |
In the display area, note how the pump speed and circuit pressure both increase, but that no other parameters change. Eventually, at 5000 rpm you should see a circuit pressure of about 750 mm Hg. So what’s going on here? - Well, we’re running the pump with the outlet line fully clamped. As we increase the rpm, so we increase the total energy delivered to the system – but, because the blood can’t go anywhere, the pressure within the pump head (‘stagnation pressure’) progressively rises. This is characteristic behaviour for a (non-occlusive) centrifugal pump and can be contrasted with the behaviour of volumetric ‘roller’ pumps which are commonly used during routine cardio-pulmonary bypass.
Figure 4.
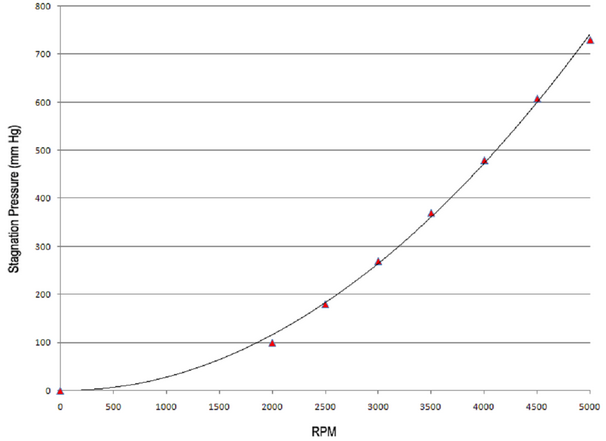
The relationship between this ‘stagnation pressure’ and RPM is shown in Figure 4 - where the black line represents the behaviour of the simulator’s centrifugal pump and the red triangles the stagnation pressures of a modern ECMO system (Maquet CardioHelp © ) at the various rpm’s.
Now let’s see what happens if we go through the same exercise, but with the outlet line unclamped.
Before we do this, we’ll perform a baseline blood gas analysis:
|
Click <Investigations><Arterial Blood Gas Analysis>in the <Inspector> window. |
And return to the ECMO system:
|
Click <Devices> <ECMO System> in the <Inspector> window. |
Now, turn the flow control back to zero and set a flow of oxygen of about 8 lpm. Fully release the outlet clamp by sliding the clamp control to the top of the scale and slowly increase the pump rpm to about 2250. This time, the response of the system is quite different. In the data display area, note that the pressure increase is much smaller, that blood is flowing through the system at about 3.4 lpm and that the SvO2 is rising. On the patient monitor, there has been no great change in either CVP or arterial pressure, but the saturation has risen, and the frequency of ectopy has fallen. If you now further increase the rpm, you’ll see that both flow and pressure begin to fall progressively until eventually (at about 4000 rpm) flow ceases completely. We’ll explore the reasons for this in a future tutorial, but, for the moment, just note it and return the rpm to about 2250 so that flow is maximized.
Start the timer on the patient monitor:
|
Click the <Timer> button in the <Patient Monitor> window. |
And, after five minutes, repeat the blood gas analysis. Compare the results with the previous analysis. The salient differences are that:
| • | The PaO2 is higher. |
| • | The SaO2 is higher. |
| • | The PaCO2 is markedly lower. |
Note that we have successfully raised the PaO2 to a ‘safe’ level (~60 mm Hg) and that the PaCO2 is now quite low. However, the PaO2, while improved, is hardly excessive. These blood gas results (effective normalization of PaCO2 but with a lesser impact on PaO2) are typical of patients undergoing VV ECMO. In future tutorials we’ll explore ways of achieving a greater impact on arterial oxygenation in patients on ECMO.
Now let’s experiment with the effect of changing the gas flow rate through the oxygenator. Leave the rpm unchanged, but reduce the gas flow rate from 8 lpm to 1 lpm and re-start the timer (by clicking it twice). After five minutes, repeat the blood gas analysis and note how the PaCO2 has risen markedly, but with little change in PaO2. Thus we can see that we use the gas flow rate through the oxygenator to control the patient’s PaCO2.
In the final part of this tutorial we’ll explore the effect of reducing the blood flow through the oxygenator. We’ll do this by progressively clamping the outlet line. (This is not the way in which we would normally achieve this, but it will also allow us to illustrate another feature of the behaviour of centrifugal pumps.)
Whilst leaving the rpm unchanged, slowly clamp the outlet by moving the slider downwards over the course of a few minutes. Note how the flow decreases while the driving pressure increases until eventually the stagnation pressure (of about 150 mm Hg) is achieved and flow ceases completely.
By progressively applying the clamp we are effectively converting the kinetic energy of the moving blood to static (potential) energy. At the same time, if you look at the patient monitor, the saturation will have fallen and the heart rate and incidence of ectopy will have increased. If we repeat the blood gas analysis we will see that, once again, PaO2 has dropped. Thus we can see that blood flow through the oxygenator is an important determinant of arterial oxygenation.
The observation that the kinetic and static energies of a fluid were ‘interchangeable’ and that the total energy of a fluid could be considered as the sum of its kinetic and static components was first described by Daniel Bernoulli in 1738. It is the cause of the ‘afterload dependence’ of centrifugal pumping systems and is the explanation of the flow variability which is seen in some clinical situations. It can be contrasted with the behaviour of volumetric (‘Roller’) pumping systems which are widely used during routine cardio-pulmonary bypass.
In summary, we have now explored some of the features of a modern VV ECMO circuit and have experimented with the basic controls of such a system. The impact of VV ECMO on oxygen and carbon dioxide exchange in a patient with severe respiratory failure has been demonstrated. We have shown that we can control the patient’s arterial oxygenation by varying the blood flow through the system and the patient’s PaCO2 by varying the gas flow through the system. We can formulate these observations as two ‘rules’:
PaO2 is proportional to ECMO Blood Flow.
PaCO2 is proportional to ECMO Gas Flow.
In future tutorials we’ll examine the determinants of oxygen transfer in much more detail, explore the effect of adjusting cannula position, characterize the impact of using dual drainage cannulae and learn to identify clinical problems including re-circulation and caval collapse.