
The effect of blood flow on oxygen transfer.
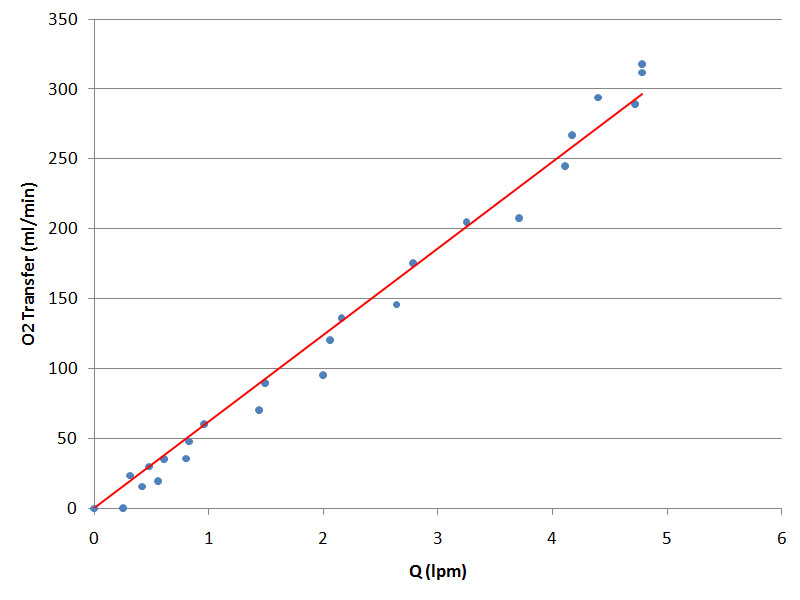
The relationship between oxygen transfer and blood flow through the oxygenator is shown in this graph.
The data were obtained from a 'virtual' patient (at 36.9 C) who had a native cardiac output of ~ 5.0 lpm and who was ventilated with air. At the beginning of the experiment, the patient was rendered asystolic by the supervisor. Immediately after the onset of asystole, VA ECMO was initiated and the flow was progressively increased from 0 to 5 lpm over the course of a few minutes.
As can be seen, there is a more-or-less linear relationship between oxygen transfer rate and blood flow through the oxygenator.