
The effect of FiO2 change on PaO2.
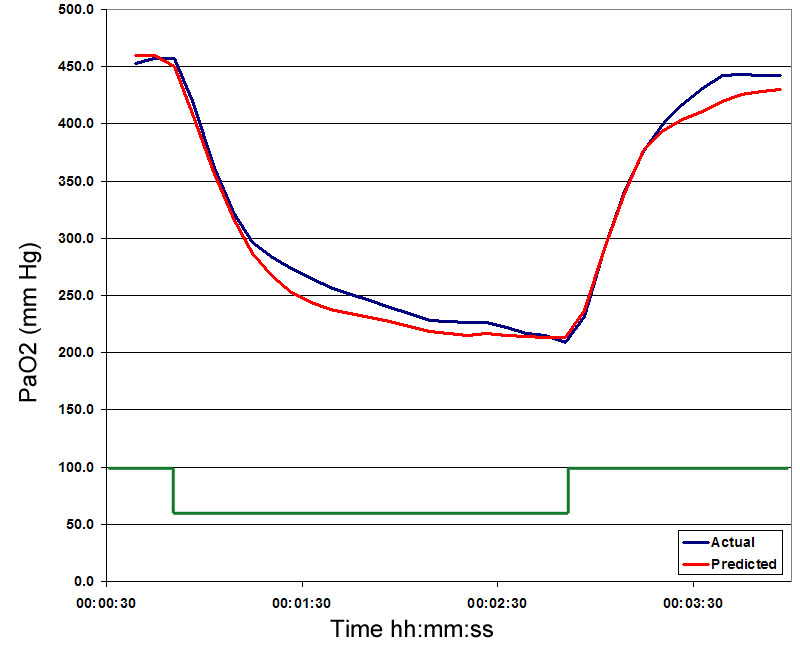
The figure above compares data acquired synchronously and in real-time from two sources. The real data (Blue) were acquired from a CDI 500 in-line blood gas analyser connected to a patient on stable cardiopulmonary bypass at 32 C. The patient was perfused using a Sarns HLM and a 2.5 m Terumo 'Capiox' oxygenator. The simulated data (Red) represents the real-time predictions of PaO2 made by the simulation system (which had been adjusted to model the performance of the 'Capiox' oxygenator).
At about 1 minute into the recording, the FiO2 is reduced from 1.0 to 0.61 and after 2 minutes it is returned to 1.0 (Green). As can be seen, there is good agreement between the real and predicted measurements of PaO2.