The relationship between Qs/Qt and Cardiac Output.
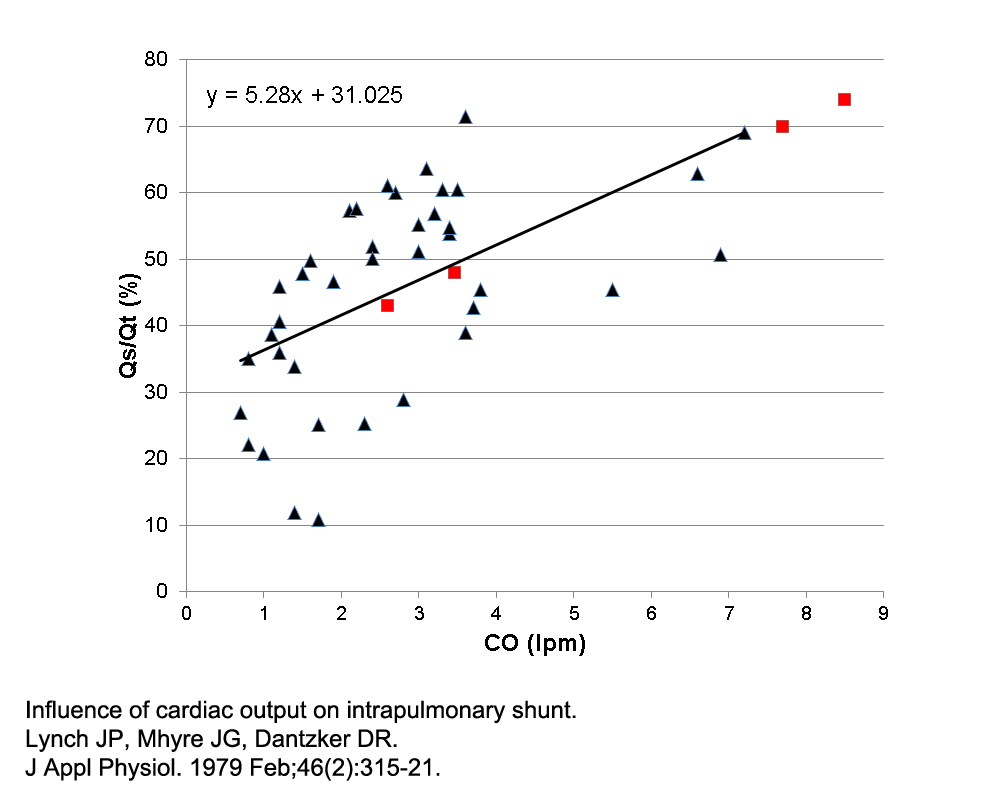
The effect of a change in cardiac output on the magnitude of Qs/Qt is shown in the figure above.
Shown in black are the data (and trendline) obtained by Lynch et al in a group of 10 dogs with oleic acid-induced lung injury.
The four data points shown in red represent the change in QS/Qt which occurs when cardiac output is increased from ~ 2.5 lpm to ~ 9 lpm in a simulated patient with a lung injury of comparable severity to that found in the dogs.
It should be noted that the relationship between changes in CO and Qs/Qt was only added in version 5.7 of the simulator. The author is grateful to Dr Roger Pye (of St Vincent's Hospital, Sydney) for advice on this matter.